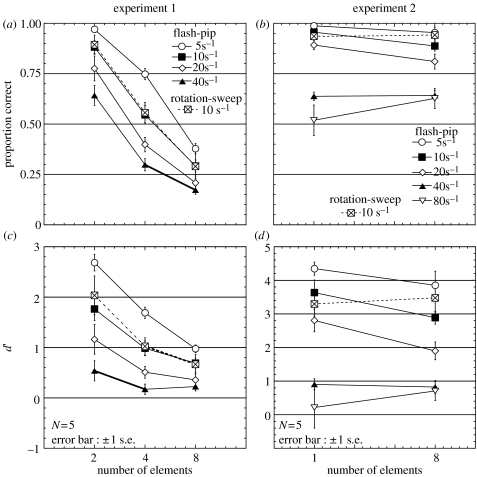
Figure 3.
(a) Results obtained in experiment 1. The proportion correct for different densities of flash-pip stimuli (5, 10, 20, 40 pulses s−1) and rotation-sweep stimuli (10 reversals s−1) as a function of the number of visual elements (2, 4, 8). (c) The same data expressed in terms of d′. (b) Proportion correct obtained in experiment 2 (synchrony discrimination of pre-cued target) as a function of the number of visual elements (1, 8). (c) The same data expressed in terms of d′.

