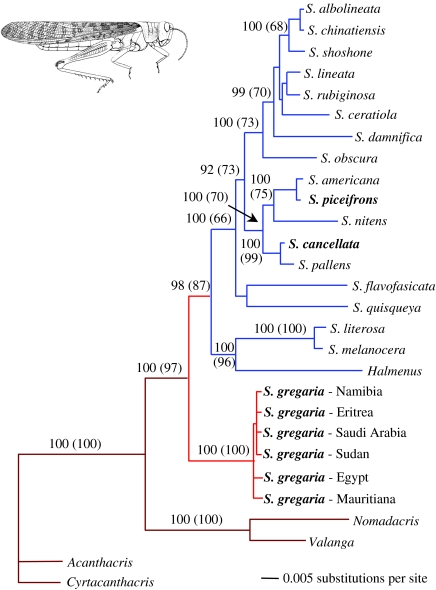
Figure 3.
Maximum-likelihood tree showing relationships among Western Hemisphere Schistocerca species and the basal position of S. gregaria, a pattern observed using all phylogenetic methods. The tree is rooted using outgroup taxa from the subfamily Cyrtacanthacridinae. Bayesian posterior probabilities and parsimony bootstrap values (in parentheses) are included for nodes of major biogeographical interest. Colours reflect the distributions of species as depicted in figure 2 (dark red, outgroups; light red, S. gregaria; blue, Western Hemisphere species of Schistocerca). Swarming taxa are indicated in bold. Image of S. gregaria after Dirsh (1965).

