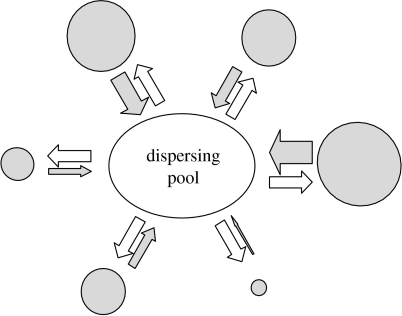
Figure 1.
Diagram of the population structure in the model. The population is divided into demes differing in their average fertility. Demes with higher average fertility are plotted as larger discs. All young individuals have the same probability α to disperse and move to the general ‘dispersing pool’. Demes with higher fertility produce more emigrants (thick shaded arrows), and the fraction of immigrant young within them is lower.

