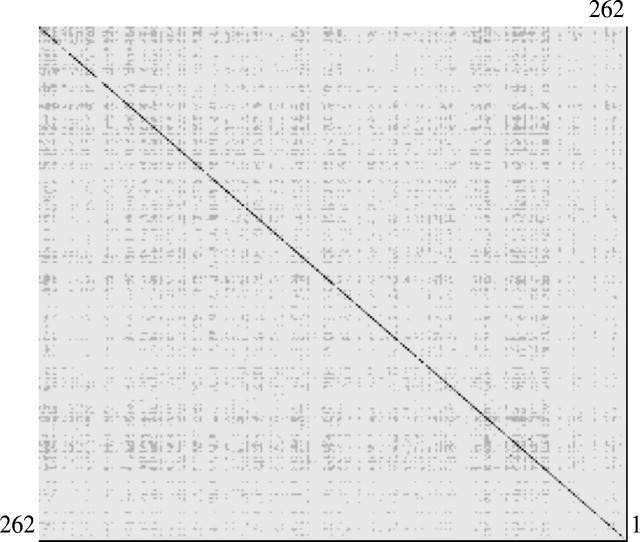
Figure 2.

The similarity matrix: N×N (N: numbered teeth from 1 to 262). Toothprints were classified into four groups according to the similarity scores: group I, 2000–1001 bits (very high similarity) (black filled square); group II, 1000–101 bits (high similarity) (dark grey filled square); group III, 100–10 bits (low similarity) (light grey filled square); group IV, 9–0 bits (very low similarity) (open square). The dark line on the main diagonal shows that the highest scores (i.e. the best match) were always achieved when a tooth was compared with itself on the database.
