Figure 4.
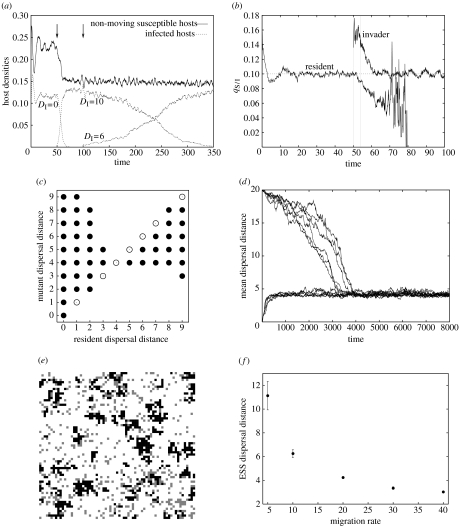
Manipulation of host dispersal distance. (a) Invasion analysis of the stochastic model. The introduction of mutant parasites into the population is indicated by arrows. (b) Local densities of susceptible hosts as seen by resident and mutant parasites. The local densities are computed from the run shown in (a), but we only present the first invasion (t<100). The vertical dashed lines delimit the interval where the mutant is rare. (c) Numerical pairwise invasibility plot. Filled circles indicate that the mutant has invaded after 300 time units. Open circles were added to complete the diagram when the resident and the mutant are the same. (d) Evolution of the mean migration distance on a 100×100 lattice. Six stochastic realizations are shown for each of two initial conditions (DI=0 or 20). (e) Snapshot of part of the lattice on its attractor, for DI=5. (f) ESS dispersal distance for different values of migration rate mI. The mean and standard deviation are calculated from a sample of 10 runs. Lattice size: 100×100. Unless otherwise specified, all parameters are as in table 1, lattice size is 300×300, mI=20, bI=0, γ=0.

