
Table 1.
Symbols and description of the model when migration is only local.
| type | symbol | description | default value | event and event rate |
|---|---|---|---|---|
| space | n | number of nearest neighbours | 4 | |
| ϕ | probability of drawing a neighbour at random | 1/4 | ||
| demography | bS | birth rate of susceptible host | 4 |  |
| bI | birth rate of infected host | 2 |  |
|
| βI | infection rate | 10 | 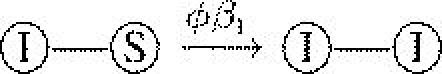 |
|
| dx | death rate of type x (S or I) | 1 |  |
|
| mI | migration rate of infected host | 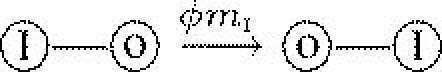 |
||
| μ | mutation rate | 0.005 |  |
|
| γ | cost of manipulation | 0.05 | ||
| σ | mutation step | 1 | ||
| variables | px | global density of type x | ||
| qx/y | local density of type x as seen by type y |