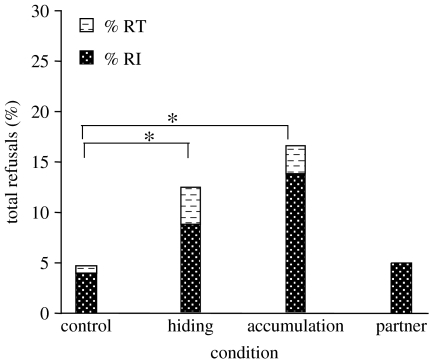
Figure 3.
Percentage of total refusals: total refusals to initiate a trial (RI, black with white dots) and to take and eat the less preferred food (RT, white with black dashes) in each condition. The percentage of total refusals in the hiding and accumulation conditions differed significantly from that of the control condition. *p<0.001.

