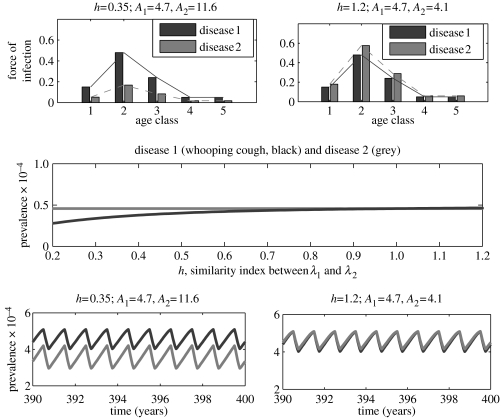
Figure 5.
A one-parameter bifurcation diagram and example time-series for the two-disease age-structured model. In all panels, diseases 1 and 2 are identified by black and grey, respectively. A1 and A2 represent, respectively, the mean age at infection for diseases 1 and 2. Disease 1 has the same epidemiological traits as whooping cough (table 1). Disease 2 also has the same epidemiological traits as whooping cough except that the force of infection is assumed to be λ2=hλwc. The seasonal amplitude is fixed at b=0.2.

