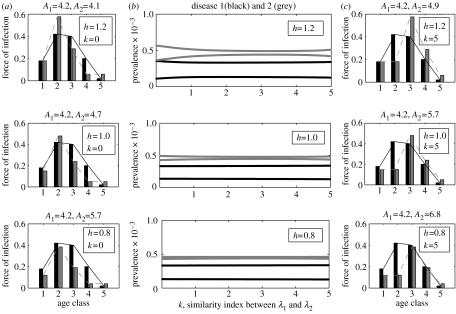
Figure 6.
Bifurcation diagrams for the two-disease age-structured model illustrating (b) the two-disease dynamics as a function of the similarity index k for some different values of h, and (a, c) the two diseases' ASFOIs for some pairs of h, k. The precise meaning of h and k can be found in the main text (see § 3.1). In all panels disease 1 is identified by black, disease 2 by grey. Seasonal amplitude b≡0.2.

