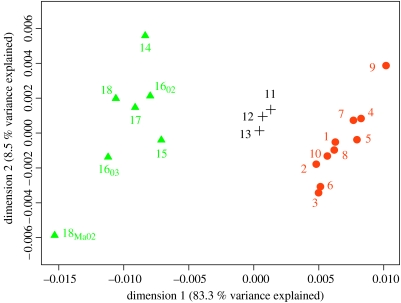
Figure 2.
Multi-dimensional scaling plot of pairwise FST estimates between herring spawning collections. Temporally replicated samples were pooled except when genetically distinguishable (i.e. Rügen and Koldingfjord). Symbols: filled circle in orange, samples pooled into region 1 (North Sea), comprising autumn spawners (1–7), spring spawners (9–10) as well as winter spawners (8); plus, samples pooled into region 2 (Skagerrak), comprising spring spawners (11–13); filled triangle in green, samples pooled into region 3 (Kattegat and Western Baltic) comprising spring spawners (14, 15, 1602, 1603, 17, 18, 18MA02). Hierarchical AMOVA estimates of variance: % variance among regions: 0.90 (p<0.001), % variance among populations within regions: 0.17. In the multi-dimensional scaling analysis we considered five dimensions. Dimensions 1 and 2 are plotted here; dimensions 3, 4 and 5 explained 4, 2.4 and 1.8% of the total variance, respectively.

