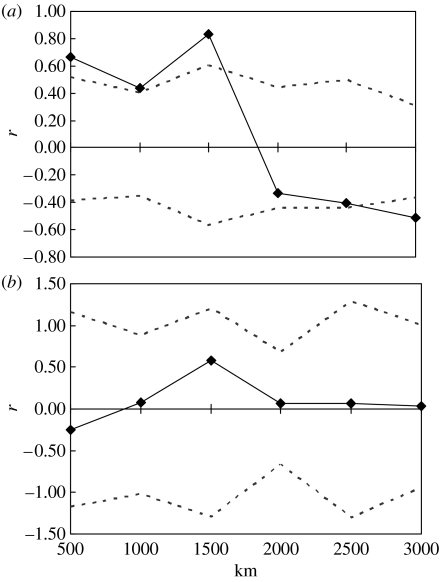
Figure 4.
Multilocus spatial autocorrelation analyses for: (a) French grunts and (b) bluehead wrasse at a Caribbean basin-wide scale. Data points (diamonds) are r (correlation coefficient) values of genetic distance between populations separated by distances in the preceding 500 km distance class. Dashed lines are upper and lower 95% confidence intervals for all data in the distance class. When an r value lies above the upper confidence interval, populations in that class are genetically more similar than would be expected by chance.

