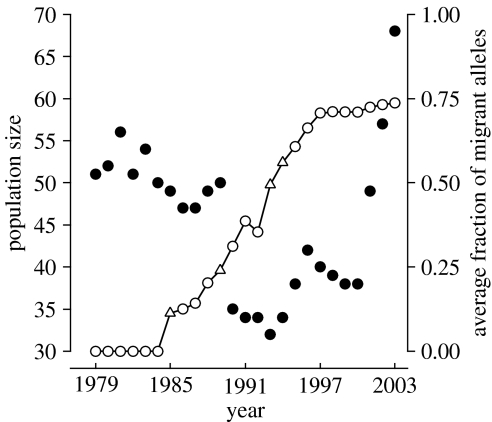
Figure 3.
Total number of native bighorn (residents minus migrants; filled symbols) in relation to the average fraction of migrant alleles carried by resident bighorn (natives plus migrants; open symbols) during 1979–2003. Reversal of a multi-year decline in population size coincided with the year (1993) in which the average resident carried a majority of migrant alleles. Because migrants were excluded from annual population number (filled symbols, left axis), population changes are entirely due to reproduction and mortality within the NBR population. Years in which migrants arrived are indicated by open triangles (left to right, migrants were five males, one female, three males/three females and three females). Ten rams removed at various ages for transplant prior to 1985 were included in the population count by (conservatively) assigning each a lifespan of 10.5 years.

