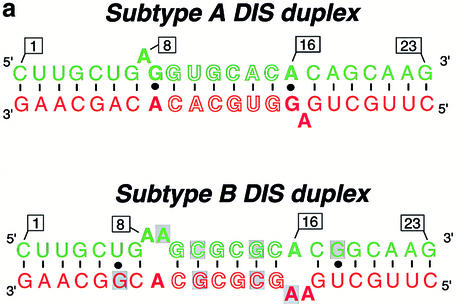
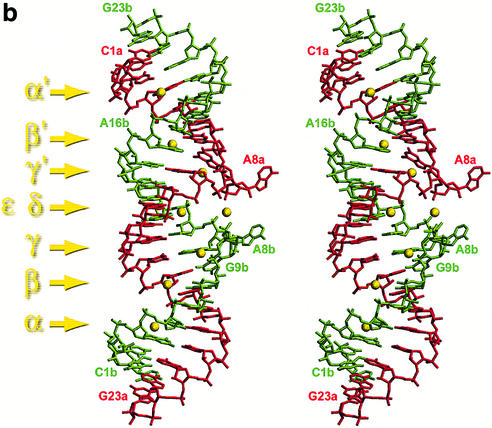
Figure 1.
Structures of the oligonucleotides used in this study. The two homologous strands are represented in red and green. (a) Primary and secondary structure of subtype-A and -B DIS duplex. The changes in sequence are highlighted in grey in the subtype-B duplex. (b) Stereoview showing the crystal structure of the trigonal form of the subtype-A DIS duplex (15) with magnesium cations represented as yellow spheres and labeled with Greek letters.


