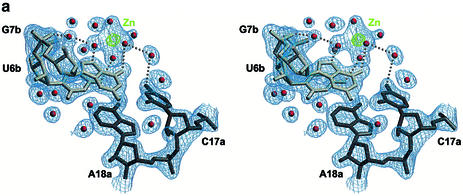
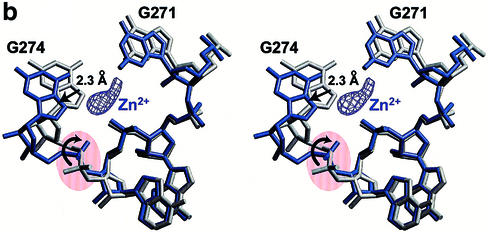
Figure 3.
(a) Stereoview of Mg2+-like hexahydrated Zn2+ binding to the Hoogsteen site of a guanine base (site β in Fig. 1a). The electron density map (in blue) was calculated with (2Fobs – Fcalc) coefficients and contoured at 1.2 σ above mean level. The green peak corresponds to an anomalous difference map contoured at 10 σ above mean level. The picture, to be compared with figure 5 in Ennifar et al. (15), illustrates very well the involvement of a network of water molecules in cation binding. (b) Stereoview showing the conformational change induced upon Zn2+ binding in the bulge region of the subtype-B DIS duplex. The native structure is depicted in gray and the Zn-bound structure in purple. The anomalous map contoured at 8 σ above mean level clearly shows a delocalization of the divalent cation.


