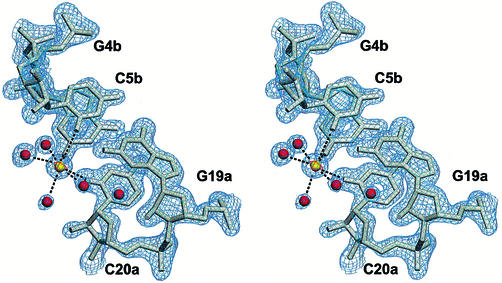
Figure 7.
Potassium binding sites in the subtype-B DIS duplex. The (2Fo-Fc) electron density map contoured at 1.4 σ, and the anomalous difference maps contoured at 4.0 σ above mean level are shown in blue and red, respectively. Potassium ions and water molecules are represented as yellow and red spheres, respectively.

