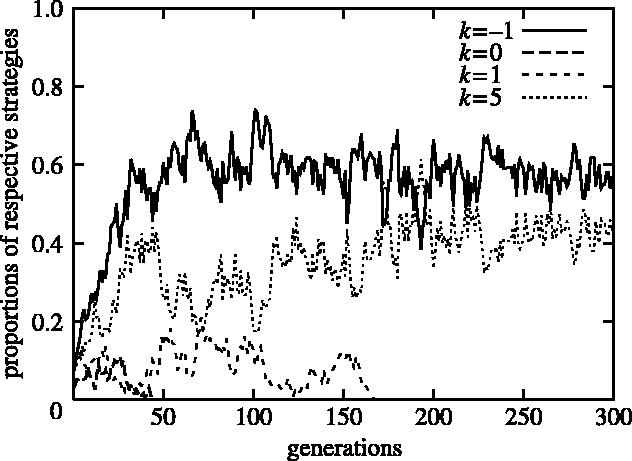
Figure 4.

A typical evolutionary development towards the polymorphism of two strategies (population size n=200; group size g=20; the number of rounds m=4n): the proportions of respective strategies in the population are plotted as functions of the generation for the first 300 generations of the simulation.
