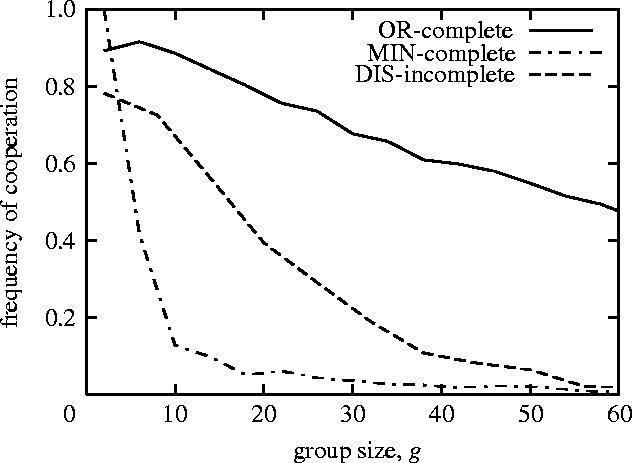
Figure 5.

The frequency of cooperation decreases with the increase in group size (population size n=200; the number of rounds m=4n): the frequency of cooperation at the 1000th generation is plotted as a function of group size. Each point denotes the averaged value over 1000 computer simulation runs in the three situations (OR-complete, solid line; MIN-complete, dash-dotted line; DIS-incomplete (q=0.5): short-dashed line).
