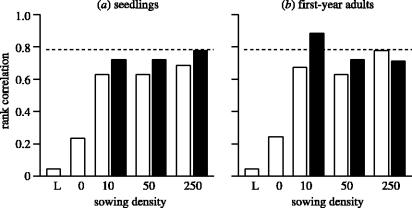
Figure 1.
Correlations (Spearman rank) between seed size and abundance for (a) seedling and (b) first-year adult communities at each of four sowing densities in both single-sown plots (open bars) and mixture-sown plots (filled bars). For comparison, the correlation in the long-term data (L) is also shown. The dashed line shows the critical value for a 2-tailed test (n=7, p=0.05). Values were obtained by summing abundances across all plots of the same sowing density.

