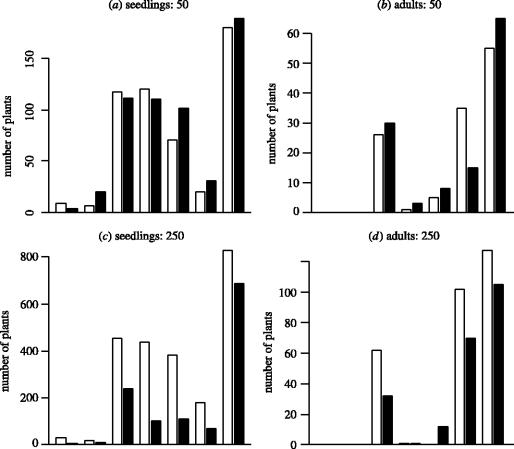
Figure 3.
The total number of (a, c) seedlings and (b, d) first-year adults for each of seven species, in (a, b) plots sown with 50 seeds and (c, d) plots sown with 250 seeds and in both sown-alone (open bars) and mixture-sown plots (filled bars). Bars are arranged in order of increasing seed size. There was significant but equal suppression of all species' seedling numbers in mixture plots, regardless of seed mass. There was no significant suppression of adult plants.

