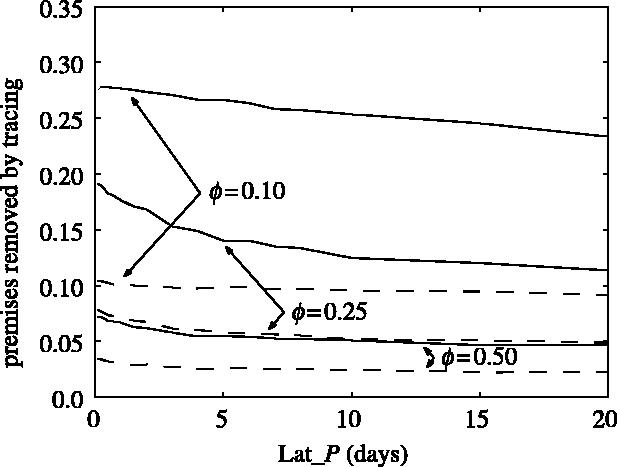
Figure 8.

Plots of the final proportion of susceptible nodes (continuous lines) and exposed and infectious nodes (dashed lines) removed through tracing during the epidemic for different latency periods (Lat_P) for different random spatially clustered networks. The other values of the parameters are: K=10, R0MF=3.0, Inf_P=3.5, Lat_P=3.5, Tr_P=2.0, r20=2.5, r40=2.5 and r60=2.5.
