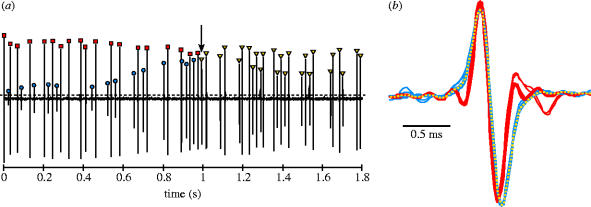
Figure 2.
Example of the method used to detect and discriminate EOD times of occurrence. (a) Short segment of a low-pass filtered continuous electrical recording of two individuals (videotaped together). EODs (marked by symbols) are detected as positive peaks in the electrical recording that exceed a manually set threshold (dashed horizontal line). (b) Overlays of all EODs up to the point in (a) marked by the arrow. EODs are centred on their head-positive peak with peak-to-peak amplitude normalized (head-positive plotted upwards). Starting with the first EOD in the sequence (arbitrarily designated as individual i), the expanded EOD waveform is displayed and colour coded red. The next EOD is then superimposed on the previous EOD. Based on visual comparison of waveforms, the second EOD is assigned to individual ii and colour coded blue. The third EOD is then superimposed on all preceding EODs and, in this case, assigned to individual i. This sequence is continued until all EODs in the record have been assigned. The arrow in (a) indicates the yellow EOD waveform currently being inspected in (b), which would be assigned to individual ii.

