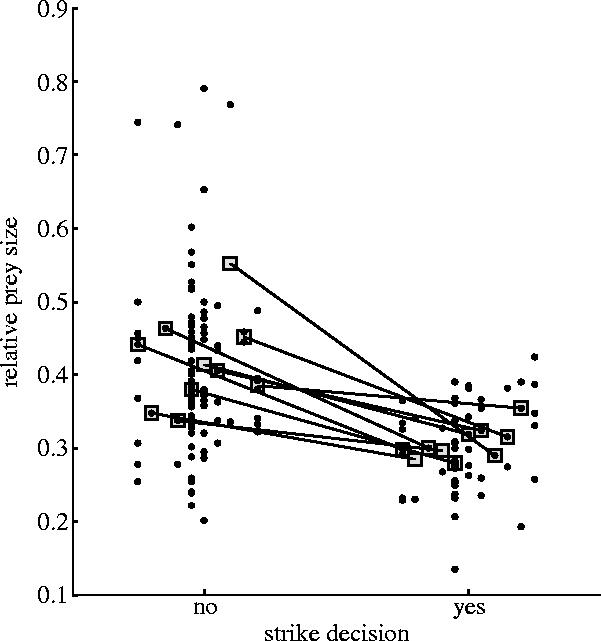
Figure 6.

Relative prey sizes for two categories of predatory behaviour: strike decision= ‘no’; strike decision=‘yes’. Within each category, points corresponding to the same predator are aligned vertically and dithered relative to those of other individuals. Five strike attempts by ‘unknown’ individuals (see figure 3) are plotted at the far right. Prey size differs significantly between categories, whether predator medians (boxes connected by lines; p=0.0051; Wilcoxon paired-sample test) or all prey (p<0.000 01; Mann–Whitney U test) are compared.
