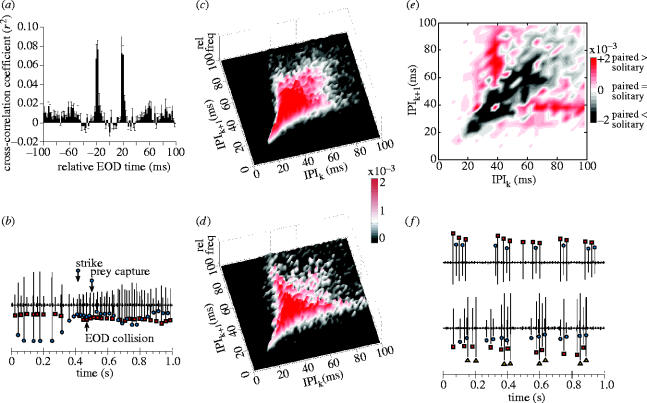
Figure 7.
Interactions in EOD output of multiple predators. (a) Mean cross-correlation histogram of EOD occurrence times (±s.e.m.; n=8 pairs). (b) Voltage trace recorded from two hunting fish (different symbols mark the EODs of each individual). Reciprocal echoing at the beginning of the trace broke down and a collision of EODs occurred when both individuals increased their EOD output rates upon encountering a cichlid. Neither predator performed ‘stationary probing’. One predator captured the cichlid and rapidly departed. (c) Surface plot showing a JIH of pulse interval data from 13 video clips of solitary hunters (15 398 EOD intervals total). Each interpulse interval (IPIk+1) is plotted as a function of the preceding interval (IPIk), and the relative frequencies within each bin are indicated by surface height and colour (bin width=2 ms). (d) Same plot as in (c) but for pulse interval data from eight video sequences of paired hunters (5766 EOD intervals total). The colour bar (to the right, between (c) and (d)) is the relative frequency scale for both plots. (e) Contour plot of the difference between (d) and (c) (paired hunter JIH – solitary hunter JIH; bin width=4 ms). Contour height (red, positive difference) or depth (grey, negative difference) is indicated by the colour bar to the right. (f) Two examples of synchronized bursting: (upper voltage trace) between two individuals upon encountering one another after a brief separation during hunting; (lower trace) among three individuals in their cave shelter during a pause from hunting.

