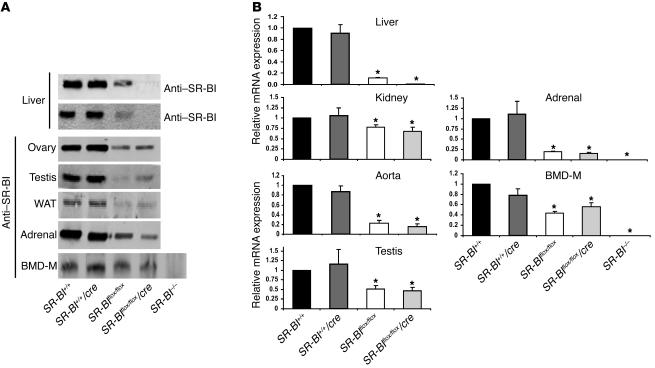
Figure 2. Levels of SR-BI expression.
(A) For each SR-BI genotype, total protein extracts were prepared from the indicated tissues and loaded onto SDS-PAGE, followed by immunoblotting with an anti–SR-BI antibody (or with an anti–SR-BII antibody for liver extracts) directed against the C-terminal domain of the protein. WAT, white adipose tissue; BMD-M, BM-derived macrophages. (B) Relative SR-BI mRNA levels. Total RNAs extracted from tissues were pooled (4–8 mice per group), reverse-transcribed, and subjected to real-time PCR quantification. Values (mean ± SD) represent the amount of SR-BI mRNA relative to that measured in control mice, which was set arbitrarily to 1. Data for BM-derived macrophages were generated from 1 representative RNA preparation for each SR-BI genotype. *P < 0.05 compared with controls.

