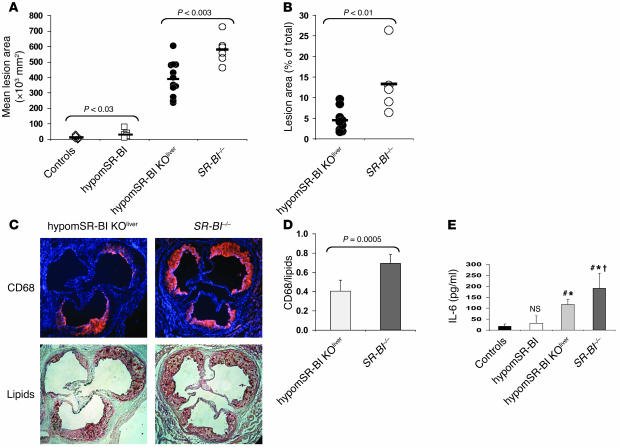
Figure 5. Quantification of atherosclerosis and inflammation in mice fed the atherogenic HFC diet.
(A) Degree of atherosclerosis in the aortic root area. Lipid deposits were visualized by oil red O staining of aortic root sections. Each symbol represents the mean lesion area in a single mouse. The horizontal bar indicates the mean value for the group. Statistically significant differences between groups are indicated. (B) Quantification of lipid lesions in the aortic arch and thoracic aorta of hypomSR-BI–KOliver and SR-BI–/– mice. Each symbol represents the percentage of the aorta stained for lipid with Sudan IV in a single mouse. The horizontal bar indicates the mean value for each group. Statistically significant differences between the 2 groups are indicated. No lipid staining could be detected in controls and in hypomSR-BI mice. (C) Increased monocyte/macrophage accumulation in atherosclerotic lesions of SR-BI–/– mice as compared with hypomSR-BI–KOliver mice. Aortic atherosclerotic lesions were immunostained for monocyte/macrophage CD68 antigen (upper panels; nuclei are visualized in blue with DAPI staining) and subsequently processed for lipid staining with oil red O (lower panels). (D) The surface ratio of CD68+ staining to oil red O–positive staining was calculated for both groups. Values represent the mean ± SD of 6 size-matched lesions analyzed per group. (E) IL-6 plasma levels in HFC diet–fed mice. #P < 0.03 compared with controls; *P < 0.05 compared with hypomSR-BI mice; †P < 0.05 compared with hypomSR-BI–KOliver mice. NS, not statistically different compared with values for controls.

