
Figure 2.
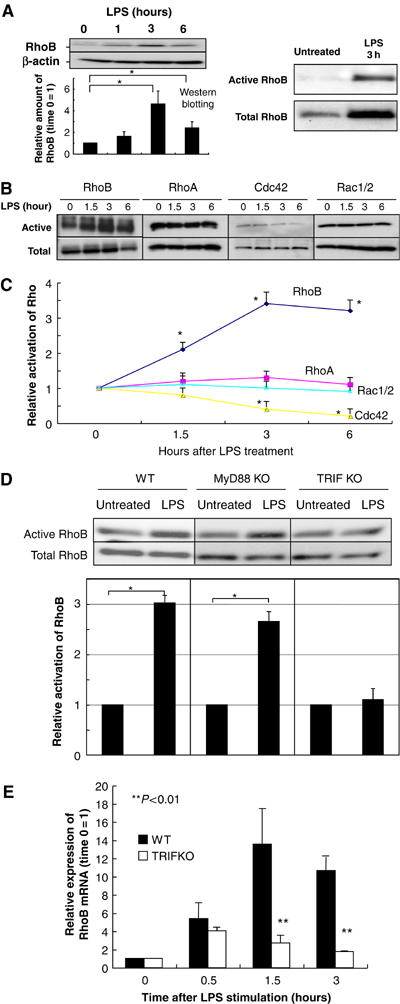
RhoB activity is enhanced by the LPS–TRIF pathway in DC. (A) (Left panel) BMDC were prepared from wild-type mice and stimulated with LPS. The protein levels of RhoB was investigated. We put the same number of CD11c+ cells that were magnetically sorted in each lane. Western blotting for RhoB is performed and relative expression of RhoB is shown in the figure. We calculated ‘time 0' as 1. Representative data from three independent experiments are shown. The relative amount of RhoB is shown with error bars indicating 1 s.d. The P-value (<0.05) was calculated by Student's t-test and is indicated by *. (Right panel) BMDC were prepared from wild-type mice and stimulated with LPS for 3 h. The protein levels of RhoB (activated or total) was investigated. The same number of CD11c+ cells that were magnetically sorted is applied in each lane. These experiments were performed at least three times independently, and representative data are shown. (B, C) BMDC were prepared from wild-type mice and stimulated with LPS for the indicated time period. CD11c cells were sorted and the activities of Rho family were investigated. The amount of total RhoB was adjusted to be the same in each lane in this experiment. The activities were compared with each other by defining the LPS-untreated control as 1. These experiments were performed three times independently, and representative data are shown. The relative activation level is shown with error bars indicating 1 s.d. The P-value (<0.05) was calculated by Student's t-test and is indicated by *. (D) BMDC were prepared from TRIFKO, Myd88KO, and control mice and stimulated with LPS for 6 h. CD11c cells were sorted and the activities of RhoB were investigated. The activities were compared with each other by defining the LPS-untreated control as 1. These experiments were performed three times independently, and representative data are shown. The relative activation level is shown with error bars indicating 1 s.d. The P-value (<0.05) was calculated by Student's t-test and is indicated by *. (E) BMDC were prepared from wild type and TRIFKO mice and stimulated with LPS. Real-time PCR of RhoB was performed. We showed relative expression of RhoB in the figure. We calculated ‘time 0' as 1. Representative data from three independent experiments are shown. The relative amount of RhoB is shown with error bars indicating 1 s.d. The P-value (<0.01) was calculated by Student's t-test and is indicated by **.