
Figure 7.
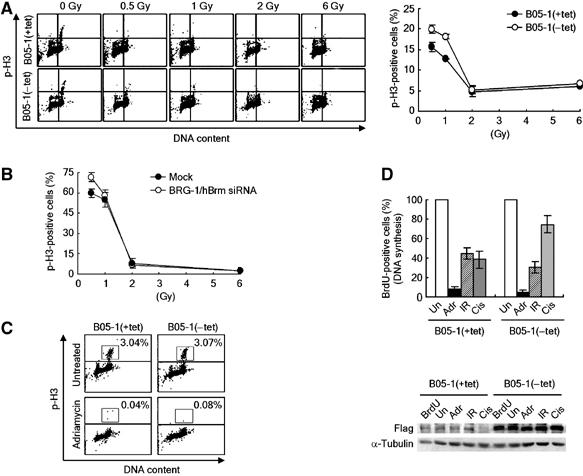
The effects of SWI/SNF inactivation on DNA damage checkpoint. (A) (Left) Analysis of G2/M checkpoint in B05-1 cells. At 1 h after irradiation by indicated doses, cells were fixed for double staining with PI and the anti-phospho-H3 antibodies followed by FACS analysis. A representative FACS result is shown. (Right) The frequency of phospho-H3-positive cells (mitotic cells) at 1 h after irradiation was represented by a percentage (irradiated/nonirradiated). An average from three independent experiments is plotted as graph with mean±s.d. (B) The effects of siRNA downregulation of BRG-1 and hBrm on DNA damage G2/M checkpoints. HeLa cells were mock transfected or transfected with BRG-1 and hBrm siRNA for 48 h, and irradiated by the indicated doses. The mitotic cells were analyzed as in (B). An average from three independent experiments is plotted as graph with mean±s.d. Note that the overall levels of G2 arrest of HeLa cells in response to 0.5 and 1 Gy are much lower than those of NIH-3T3 cells. (C) SWI/SNF inactivation has no effect on the G2/M checkpoint in response to adriamycin. Cells were treated with 0.5 μM of adriamycin for 1 h, and harvested for analysis of mitotic cells as in (A). Percentages of phospho-H3-positive mitotic cells are indicated. (D) S-phase checkpoint analysis. (Top) The levels of new DNA synthesis were determined by BrdU incorporation method after cells were untreated (Un), treated with 0.5 μM of adriamycin (Adr), irradiated by 10-Gy IR, or 32 μM of cisplatin (Cis). The number of BrdU-positive nonirradiated cells was set to 100%, and an average percentage from three independent experiments was plotted as graph with mean±s.d. (Bottom) Immunoblot analysis shows that the expression of flag-BRG-1 was properly induced by tetracycline depletion. BrdU indicates the control reactions without BrdU and other abbreviations are same as the top panel.