
Figure 5.
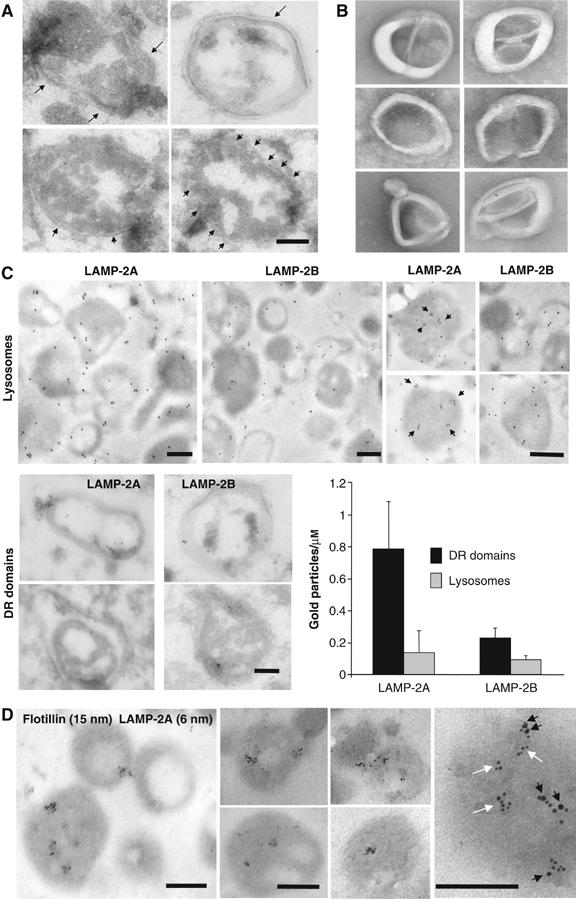
Distribution of LAMP-2A in discrete lysosomal membrane regions. (A, B) Regions of the lysosomal membrane resistant to 1% Triton X-114 recovered from the sucrose gradients were fixed and processed for electron microscopy (A) or visualized without fixation by electron microscopy (B). Arrows point to the membrane bilayer. (C) Intact rat liver lysosomes (top) and DR regions of the lysosomal membranes (bottom) were fixed and subjected to immunogold labeling for LAMP-2A and LAMP-2B, and a gold-conjugated secondary antibody as described under Material and methods. Top right panels show ‘clusters' of gold particles (black arrows) in individual lysosomes at higher magnification. Graph shows the labeling density (gold particles per μm) in the indicated fractions for both proteins. Values are mean+s.e. from the quantification of 15 different micrographs. (D) Intact rat liver lysosomes were fixed and subjected to double immunogold labeling for LAMP-2A and flotillin-1. Representative lysosomes are shown. Far right panel: zoomed-in image of the distribution of LAMP-2A in regions containing (black arrows) and not containing (white arrows) flotillin-1. Bars: 0.2 μm.