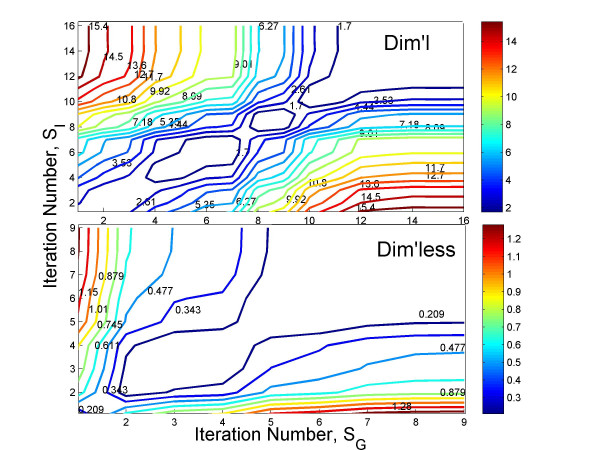
Figure 7.
Contour plot of convergence in error minimization versus the number of iterations, for subject 9 in the FUSION data set. The levels of the cost-function in the contour plot are represented through their color, and is labeled on each contour. Top: Simulation using the dimensional formulation. Bottom: Simulation using the dimensionless formulation.

