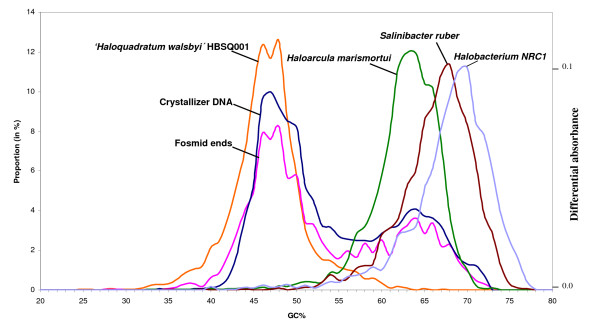
Figure 4.

GC% distribution of genes from selected halophilic genomes, of fosmid-end sequences and of crystallizer DNA. GC values of individual genomes were obtained from public databases except for Salinibacter ruber and "Haloquadratum walsbyi" that were obtained from their respective genome databases [42, 43]. The GC plot from the crystallizer DNA determined by reassociation kinetics (differential absorbance) is from reference [12].
