
Figure 6.
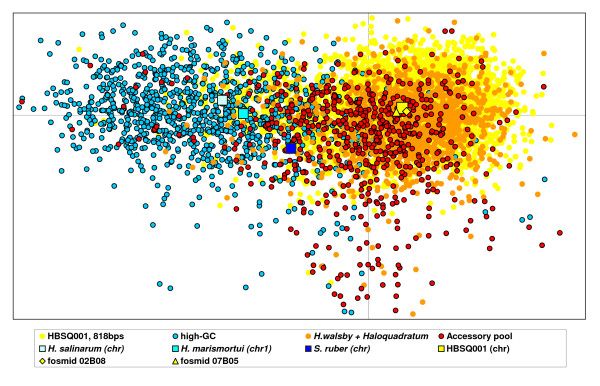
Trinucleotide analysis of fosmid end sequences. The distance between any two dots (sequences) represent relative proximity between their sequence signatures (multidimensional scaling was performed from 64-dimensions to 2-dimensions). The genome of HBSQ001, cut in chunks of 818 bp (the average size of fosmid-end sequences) is represented by dots tagged "HBSQ001, 818 bp". Dots with the "H. walsbyi" + "Haloquadratum", "high-GC" and "accessory pool" tags represent fosmid ends sequences from corresponding categories as described in the text.