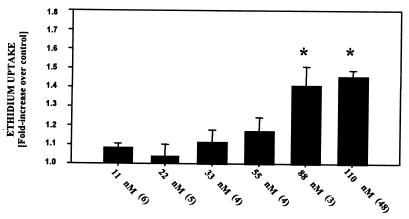
Figure 2.
Uptake of ethidium homodimer-1 by BPAEC after exposure to various concentrations of CO. Results are expressed as the difference in ethidium concentration 18 h after cells were exposed for 2 h to buffer containing from 11 to 110 nM CO. Values are means ± SEM; numbers in parentheses indicate the number of trials. *, P < 0.05 (ANOVA).

