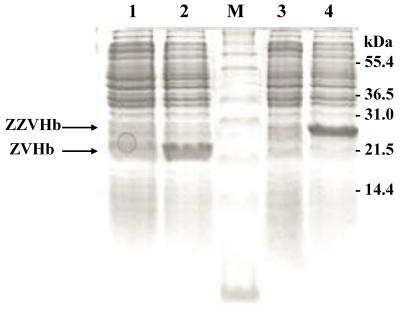
Figure 1.
SDS-PAGE represents protein profiles of cell lysate of E. coli carrying chimeric genes of ZVHb and ZZVHb before (lane 1 and 3) and after induction by IPTG (lane 2 and 4). Two major bands at molecular masses of approx. 22 and 29 kDa are shown after induction of cells expressing chimeric ZVHb and ZZVHb, respectively. M indicates molecular weight marker.

