Figure 1.
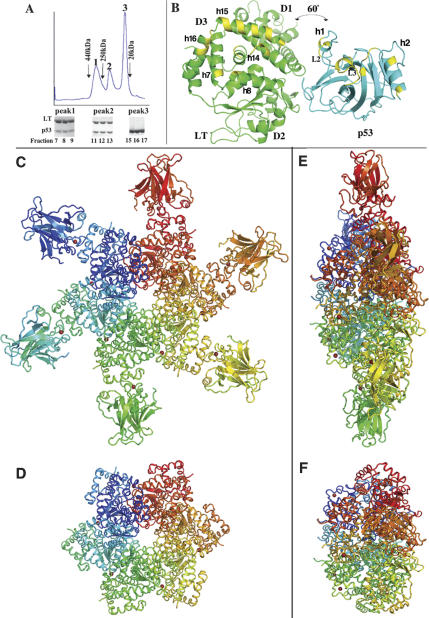
Overall structure of LTag–p53 complex. (A) The gel filtration profile of the LTag–p53 complex. The protein complex was stable when analyzed by size-exclusion chromatography on a superdex200 column. The positions for the molecular weight standard markers are indicated. Peak 1 contained LTag–p53 complex in a hexameric form (~360 kDa), peak 2 contained LTag–p53 complex in a monomeric form (~69 kDa), and peak 3 contained p53 alone (~22 kDa). The three SDS-PAGE gels below the profile show the presence of LTag and p53 in the three peaks. The excess of p53 was eluted in peak 3. (B) The monomer structure of LTag (in green) and p53 (in cyan). In order to better display the interface, each molecule was rotated 60° from its original position within the complex. The regions involved in the interface contacts in the complex are colored in yellow. LTag domains D1, D2, and D3 are indicated. (C,D) The top views of the LTag hexamer in complex with p53 (C) and the LTag hexamer stripping off p53 (D). Each of the six subunits of a LTag hexamer binds one p53 molecule as shown in A. (E,F) The side views of the LTag hexamer in complex with p53 (E) and the hexamer stripping of the p53 (F). The side view of the LTag–p53 complex structure reveals that p53 binds to the larger C-terminal tier of LTag.

