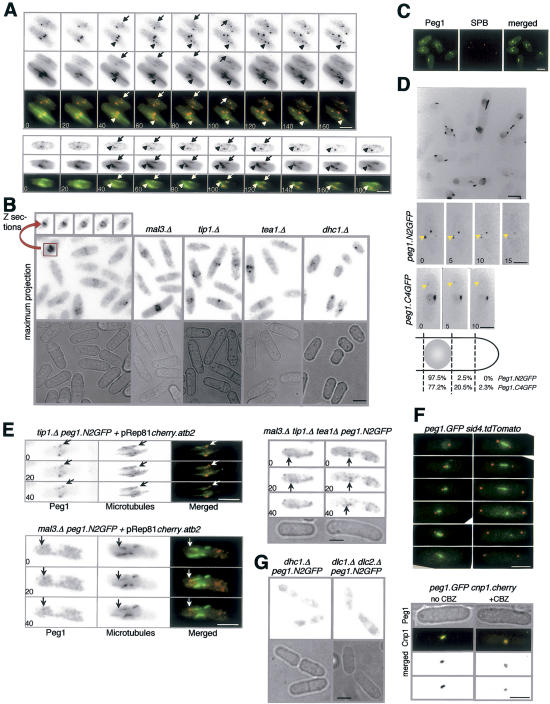
Figure 6.
Peg1 recruitment to microtubules of log-phase cells required dynein function but not Tip1, Mal3, or Tea1. Panels, B, C, D (top), and F are maximal projections of a Z-series extending through the cells. For A, D (bottom), E, and G, three consecutive planes were compressed to generate the images. (A) Peg1.N2GFP foci associate with the lattice (arrowhead) and tips (arrows) of Atb2.Cherry-marked microtubules. (B) Peg1.N2GFP fluorescence was imaged in nutrient-limited cells of the indicated genetic backgrounds. The individual panels at the top are consecutive Z-slices through the indicated peg1.N2GFP cell. (C) One of the foci that appears around the nucleus upon nutrient limitation colocalizes with the SPBs of peg1.N2GFP sid4.Tdtomato cells. (D) Peg1.C4GFP shows strong signals in nutrient-limited cells that are less constrained around the nucleus than Peg1.N2GFP. (E) Peg1.N2GFP foci in the indicated strains. (F, top) Peg1.N2GFP associates with the mitotic spindle of peg1.N2GFP sid4.Tdtomato cells throughout mitosis. (Bottom) Peg1.N2GFP signals overlay centromere signals of early mitotic peg1.N2GFP cnp1.Cherry cells, but not those of cells in which mitotic progression has been arrested by microtubule depolymerization with 50 μg/mL CBZ. Bar, 5 μm.

