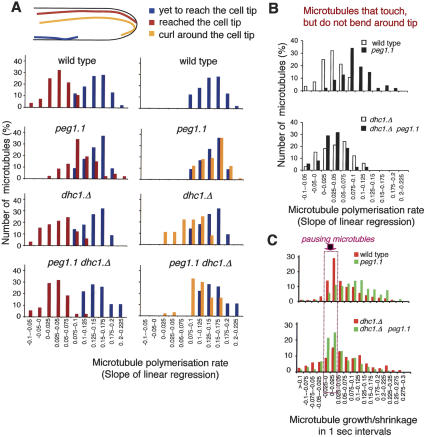
Figure 8.
Peg1 relied on dynein to slow polymerization of microtubules that establish end-on interactions with the cell cortex at cell tips, and to induce pauses between phases of microtubule polymerization and depolymerization. (A) Following photobleaching of a zone of fluorescence of GFP α-tubulin-expressing strains as in Figure 7, the length of the tip-proximal nonbleached zone was measured and plotted against time (Supplementary Fig. S7), and the linear regression of this slope was calculated. The number of microtubules for which this linear regression (rate of microtubule extension) fell into a particular interval is plotted as bar charts according to whether the microtubules were yet to reach the cell tip (blue), had reached the tip and established an end-on association (maroon), or continued to polymerize to curl around the cell tip (orange). For full data sets, see Supplementary Figure S7. (B) Bar charts that compare the data sets shown in A of the microtubules that continue to polymerize after establishing endon association with the cell tip. (C) The change in the length of the tip-proximal nonbleached zone was scored over discrete 1-sec periods and plotted against the frequency of occurrence for individual classes to generate the plots for the indicated strains. The purple arrow highlights the intervals at −0.025 to 0.0 and 0.0 to 0.025, which correspond to pauses during polymerization.

