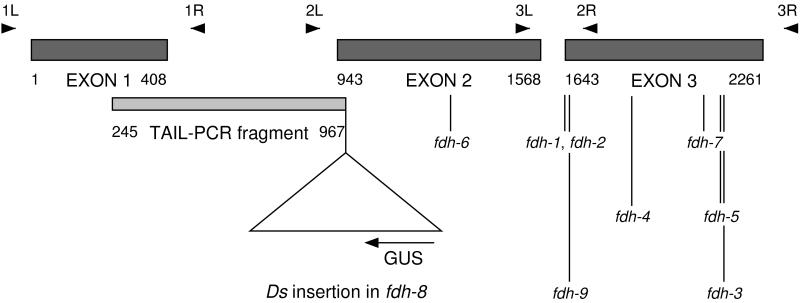
Figure 1.
Schematic representation of the FDH gene showing its three exons and two introns. Numbers indicate nucleotide positions relative to the start of translation. The positions of the lesions in fdh-1 through fdh-9 are indicated as well as the location of the thermal asymmetric-interlaced–PCR (TAIL-PCR) product. Orientation of the GUS transgene is inverted relative to FDH. The locations of PCR primers are indicated by arrowheads.

