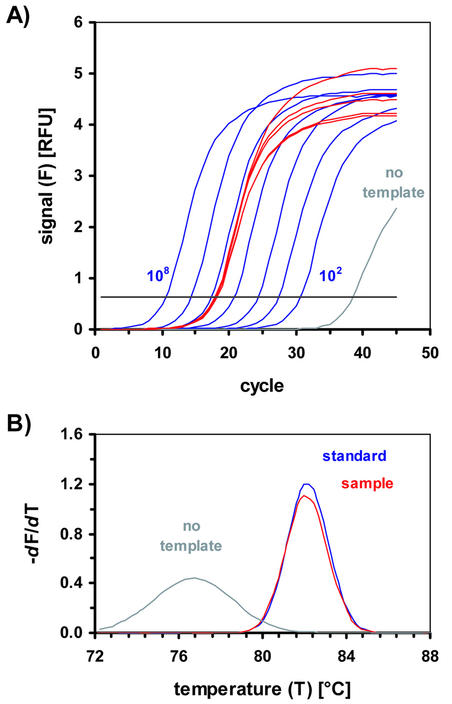
Figure 1.
Signal curves obtained in real-time PCR. (A) Amplification curves used for quantification of the rsp3 sequence from S.cerevisiae. Fluorescence signals from SYBR Green I measured in channel 1 (520 nm). The curves obtained for the standards with (from left to right) 108, 107, …, 102 copies of the standard PCR product as template are shown in dark blue. The curves for the genomic sample, measured five times, are shown in red. The gray curve represents the amplification profile of the non-template control. The threshold for the determination of the CT values is indicated by the horizontal black line. RFU, relative fluorescence units. (B) Melting curve analysis after amplification with the rps3 specific primers [amplification curves are shown in (A)]. Melting curve analysis was carried out directly after the PCR by slowly increasing the temperature at 0.2 K × s–1 from 72 to 90°C while the signal was recorded continuously. The cooperative melting process of the dsDNA causes a steep decrease in the fluorescence signal around the melting temperature of the PCR product. The signal decrease occurs as a clear peak in the negative derivative (–dF/dT) of the melting curves. The temperature where the highest value is reached is defined as the melting temperature: the specific PCR product obtained from the amplification of the standard PCR product (‘standard’, blue) melts at 82°C. The same melting temperature is determined for the PCR product of the genomic sample DNA (‘sample’, red). The PCR product amplified in the non-template control (‘no template’, gray) has a significantly lower melting temperature of 77°C. T, temperature in °C; F, fluorescence signal measured in channel 1 (520 nm).

