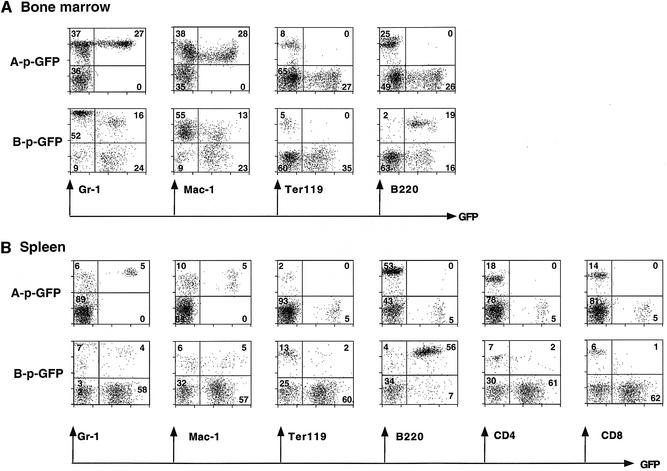
Fig. 4. Expression of A-p-GFP and B-p-GFP in the myeloid and B-cell compartment. FACS profiles of bone marrow cells (A) and splenocytes (B) from the highest expressing A-p-GFP and B-p-GFP transgenic lines. Cells were stained with lineage-specific markers (Gr-1, Mac-1, Ter119, B220, CD4 and CD8) conjugated to R-PE. FACS profiles are shown with GFP on the x-axis and the lineage marker on the y-axis. The percentage of lineage+ and GFP+ cells is shown.

An official website of the United States government
Here's how you know
Official websites use .gov
A
.gov website belongs to an official
government organization in the United States.
Secure .gov websites use HTTPS
A lock (
) or https:// means you've safely
connected to the .gov website. Share sensitive
information only on official, secure websites.
