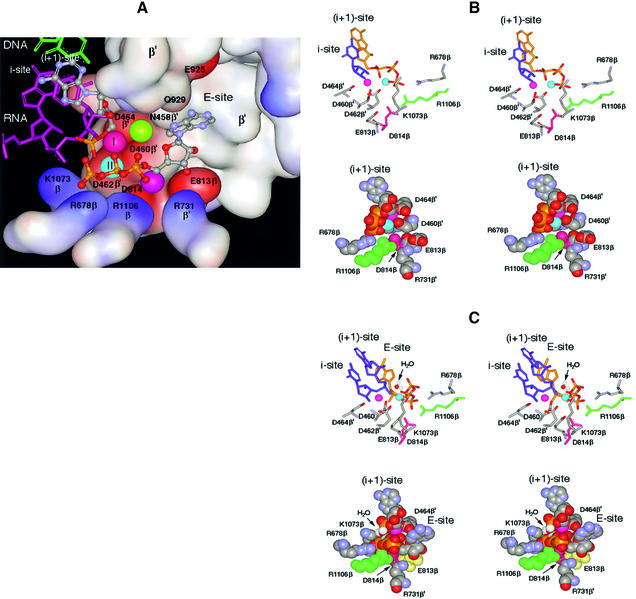
Fig. 2. Molecular model of the RNAP active center. The model combines prior knowledge and present results, as explained in the text. (A) The active center in surface rendition performing the 3′–5′ exonuclease reaction. Basic and acidic amino acid residues are represented by the blue and red surfaces, respectively. In the top left of the panel, the 3′-terminal nucleoside (gray–blue metallic) in the i + 1 site is paired with the DNA base (green). The penultimate RNA nucleotide in the i site is depicted in purple. Of the four phosphates shown (yellow–red), one belongs to the 3′-terminal NMP in the i + 1 site and three belong to the non-complementary NTP in the E-site. Balls marked I and II represent catalytic Mg-I and Mg-II. Unmarked balls indicate the positions of Mg2+ ions from the published structures [green from Vassylyev et al. (2002); purple from Cramer et al. (2001)]. The water molecule participating in the exonuclease reaction is omitted. (B) Stereoscopic rendition (for crossed eyes) of the active center performing synthesis. Crucial amino acid residues are indicated. The purple and blue balls represent Mg-I and Mg-II, respectively. Top panel: the 3′-terminal nucleotide in the i site is shown in blue and the incoming NTP in the i + 1 site in yellow; its phosphates coordinate Mg-II. Bottom panel: space-filled model of the same reaction from a different angle. The 3′-terminal nucleotide is not shown; the incoming NTP in the i + 1 site is shown. (C) Stereo view of the active center performing the 3′–5 exonuclease reaction from two angles. The arrow points to the water molecule that serves as acceptor for nucleotidyl transfer. Top panel: the two 3′-terminal nucleotides (blue) are shown occupying the i and i + 1 sites, while the yellow NTP in the E-site coordinates Mg-II. Bottom panel: space-filled model from a different angle. Only the 3′-terminal nucleotide is shown in the i + 1 site.

An official website of the United States government
Here's how you know
Official websites use .gov
A
.gov website belongs to an official
government organization in the United States.
Secure .gov websites use HTTPS
A lock (
) or https:// means you've safely
connected to the .gov website. Share sensitive
information only on official, secure websites.
