
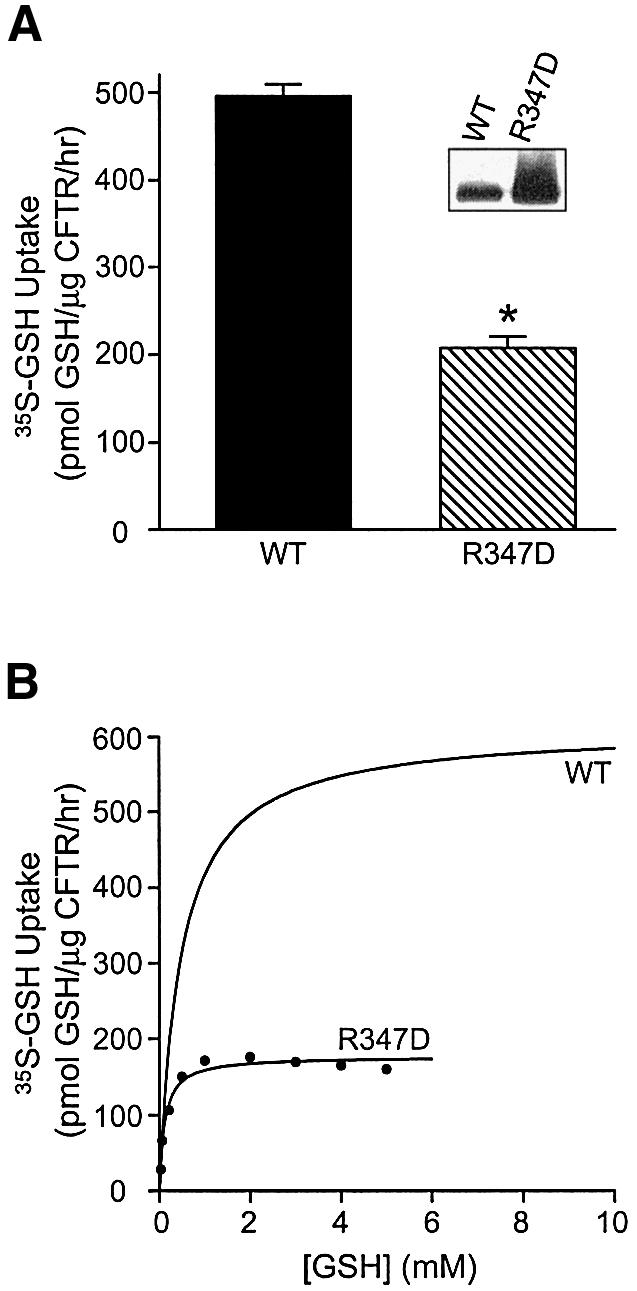
Fig. 3. Comparison of GSH flux by wild-type CFTR versus CFTR R347D protein. (A) Membrane vesicles expressing phosphorylated wild-type or R347D CFTR proteins were incubated with 20 nM [35S]GSH and 1 mM cold GSH, in the presence of MgAMP-PNP. The asterisk represents statistically significant differences in [35S]GSH flux, relative to vesicles expressing wild-type CFTR (Student’s t-test; *P < 0.0001). Values are expressed as the mean ± SEM (n = 5 for wild-type CFTR, n = 2 for R347D). Inset: expression of CFTR in membranes from Sf9 cells transfected with wild-type or R347D CFTR constructs. Membranes were solubilized in 2% SDS and Laemmli solubilizer and subjected to 4–12% SDS–PAGE. Immunoblotting was performed using the monoclonal anti-CFTR antibody M3A7 diluted 1:1000 (Chemicon International, Tamecula, CA). (B) Effect of increasing substrate concentration on [35S]GSH uptake by vesicles expressing phosphorylated wild-type CFTR or the R347D variant, in the presence of MgAMP-PNP. A graph representing GSH flux by wild-type CFTR is described in Figure 1C. [35S]GSH uptake by vesicles expressing the R347D protein was also obtained by subtracting GSH uptake values of vesicles with no CFTR from those of vesicles expressing the R347D variant. Curve fitting was performed by non-linear regression analysis, using the Michaelis–Menten equation, to yield the following kinetic parameters for the R347D mutant: Km = 0.11 mM, Vmax = 176 pmol GSH/µg CFTR/h, r2 = 0.97. GSH flux values were expressed relative to the amount of CFTR in different preparations.