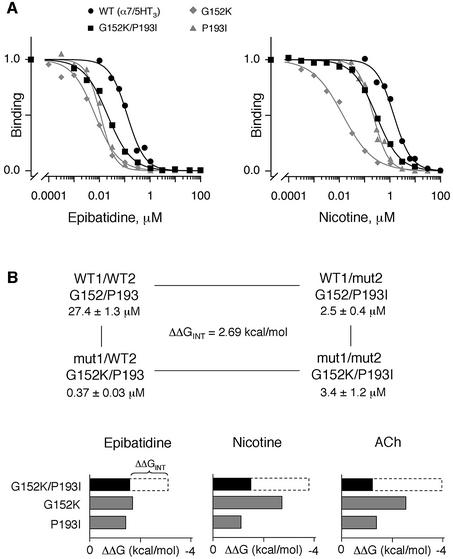
Fig. 5. (A) Competition binding curves by epibatidine (left panel) or nicotine (right panel) to [125I]α-BgTx binding sites for α7/5HT3 wild-type receptor (filled circles), G152K mutant (diamonds) and P193I mutant (triangles) or to [3H]epibatidine binding sites for G152K/P193I mutant (squares). For [125I]α-BgTx binding, membrane fragments of mutant and wild-type receptors were incubated with various concentrations of the indicated ligands until equilibrium, 2.5 nM [125I]α-BgTx was added for 5 min (initial velocity conditions) and samples were filtered and counted. For [3H]epibatidine binding, membrane fragments of G152K/P193I mutant were incubated with various concentrations of the indicated ligands, 10 nM [3H]epibatidine was added until equilibrium and samples were filtered and counted. Data normalized to values determined in the absence of ligand are the means of at least two independent experiments performed in duplicate. For clarity, standard errors are omitted. Data were fitted by the empirical Hill equation. (B) Interaction energies of G152K and P193I mutations. Upper panel: mutant cycle analysis for ACh binding between G152K and P193I. Lower panel: histograms indicating changes in the binding free energy ΔΔG upon mutations of G152K, P193I (gray boxes) and G152K/P193I (black boxes) for epibatidine, nicotine and ACh. The white dashed segments of the bars represent interaction free energies ΔΔGINT between mutants (see Table II for values).

An official website of the United States government
Here's how you know
Official websites use .gov
A
.gov website belongs to an official
government organization in the United States.
Secure .gov websites use HTTPS
A lock (
) or https:// means you've safely
connected to the .gov website. Share sensitive
information only on official, secure websites.
