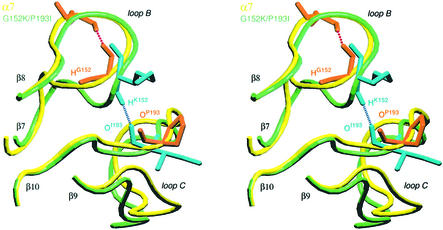
Fig. 7. Stereo view of loops B and C of α7 ECD model (yellow) and G152K/P193I mutant (green) after equilibration and dynamic simulation for 10 ps. The side chains of residues 152 and 193 are orange for α7 and cyan for G152K/P193I mutant. The figure was constructed using VMD (Humphrey et al., 1996) and generated with RASTER3D (Merritt and Bacon, 1997).

An official website of the United States government
Here's how you know
Official websites use .gov
A
.gov website belongs to an official
government organization in the United States.
Secure .gov websites use HTTPS
A lock (
) or https:// means you've safely
connected to the .gov website. Share sensitive
information only on official, secure websites.
