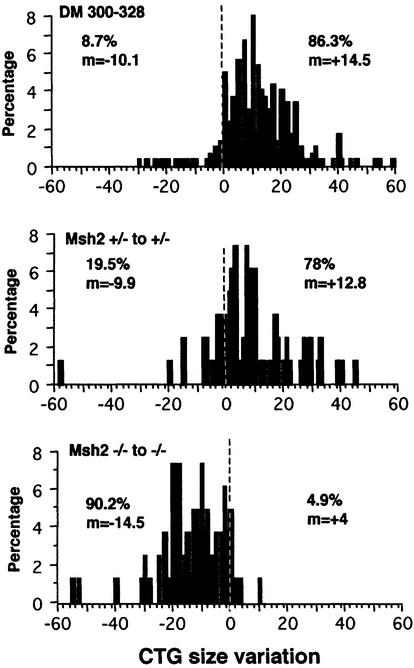
Fig. 1. Changes in CTG repeat size between transgenic parent and offspring for the various transmissions. The x-axis shows CTG repeat length change and the y-axis shows the percentage corresponding to each size change for all transmissions in each line. The frequency (%) and mean size (m) of expansions are indicated on the right. The frequency (%) and mean size (m) of contractions are indicated on the left. The number of transmissions assayed for each genotype was as follows: DM300–328, 299; Msh2 +/– to +/–, 82; Msh2 –/– to –/–, 82.

An official website of the United States government
Here's how you know
Official websites use .gov
A
.gov website belongs to an official
government organization in the United States.
Secure .gov websites use HTTPS
A lock (
) or https:// means you've safely
connected to the .gov website. Share sensitive
information only on official, secure websites.
