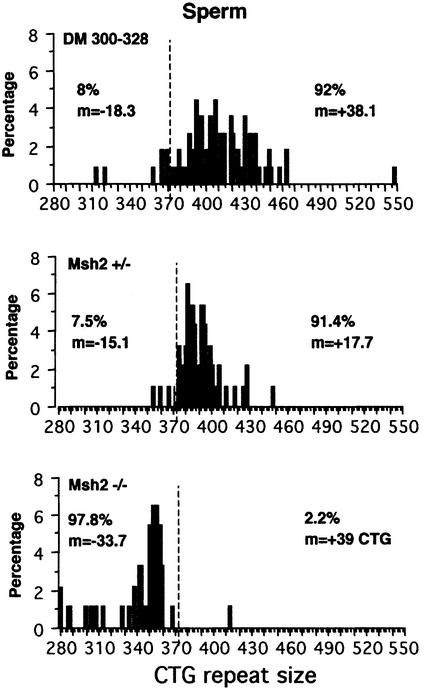
Fig. 3. Distribution of alleles with different CTG repeat sizes in spermatozoa from 10-month-old male transgenic DM300–328, Msh2 +/– or Msh2 –/– mice, as determined by single-cell PCR. The y axis shows the percentage of each size allele with respect to all single genomes analyzed. The dotted line indicates the CTG repeat size in tail DNA at weaning: 372 CTG for DM300–328, 373 CTG for Msh2 +/– and 372 CTG for Msh2 –/–. The frequency and mean size of expansions are indicated on the right and the frequency and mean size of contractions are indicated on the left. The number of single genomes analyzed for each tissue was as follows: DM300–328, 113; Msh2 +/–, 93; Msh2 –/–, 92.

An official website of the United States government
Here's how you know
Official websites use .gov
A
.gov website belongs to an official
government organization in the United States.
Secure .gov websites use HTTPS
A lock (
) or https:// means you've safely
connected to the .gov website. Share sensitive
information only on official, secure websites.
