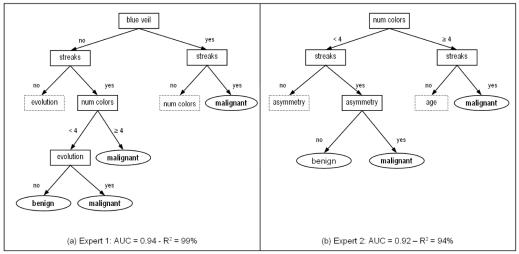
Figure 1.
Simplified excerpts of Decision Trees for Expert 1 (a) and Expert 2 (b). Due to space limitations the complete Decision Trees are available upon request as supplemental material. The dotted shapes mean that further branches are present. Moreover, some splitting nodes leading to the same final diagnosis (with different degree of certainty) are grouped together in the leaves. The AUC with respect to the clinical diagnosis, and the R2 correlation coefficient compared with the SVM predictions, are reported.

