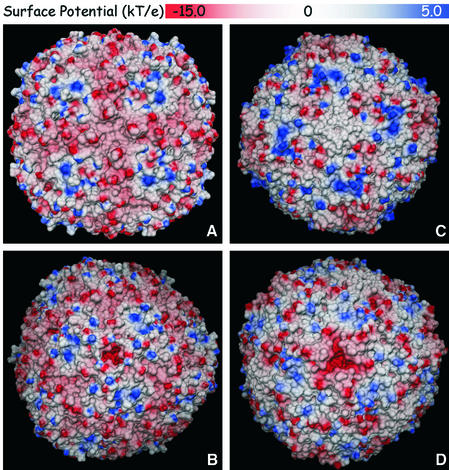
Fig. 7. Electrostatic potential surfaces of human H chain ferritin (A and B; PDB 2fha) and native horse spleen ferritin (C and D; PDB 1ier). (A and C) Views down a crystallographic 4-fold axis. (B and D) Views down a 3-fold crystallographic axis. The molecular surfaces were calculated with MSMS (Sanner et al., 1996) using a probe radius of 1.4 Å. The electrostatic potentials were calculated with MEAD (Bashford, 1997) using protein and external dielectric constants of 4 and 80, respectively, a temperature of 300 K and an ionic strength of 0.1 M; none of the metal ions present in the deposited coordinates (Ca 2+ for 2fha, Cd 2+ for 1ier) was included in the calculations.

An official website of the United States government
Here's how you know
Official websites use .gov
A
.gov website belongs to an official
government organization in the United States.
Secure .gov websites use HTTPS
A lock (
) or https:// means you've safely
connected to the .gov website. Share sensitive
information only on official, secure websites.
