Figure 3.
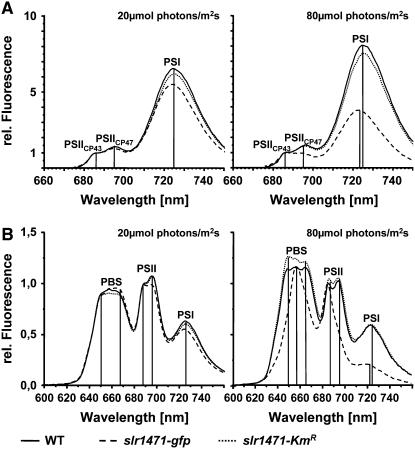
77K Fluorescence Emission Spectra of Wild-Type, slr1471-gfp, and slr1471-KmR Cells.
(A) 77K fluorescence emission spectra of wild-type, slr1471-gfp, and slr1471-KmR cell cultures (excitation at 440 nm) grown under 20 and 80 μmol·m−2·s−1 illumination were normalized to the emission at 686 nm (PSIICP43). Fluorescence emission maxima of PSI and PSII (PSIICP43 and PSIICP47) are indicated.
(B) 77K fluorescence emission spectra of wild-type, slr1471-gfp, and slr1471-KmR cell cultures (excitation at 570 nm) grown under 20 and 80 μmol·m−2·s−1 illumination were normalized to the emission at 686 nm (PSIICP43). Fluorescence emission maxima of PSI, PSII (PSIICP43 and PSIICP47), and free phycobilisomes (PBS) are indicated.

