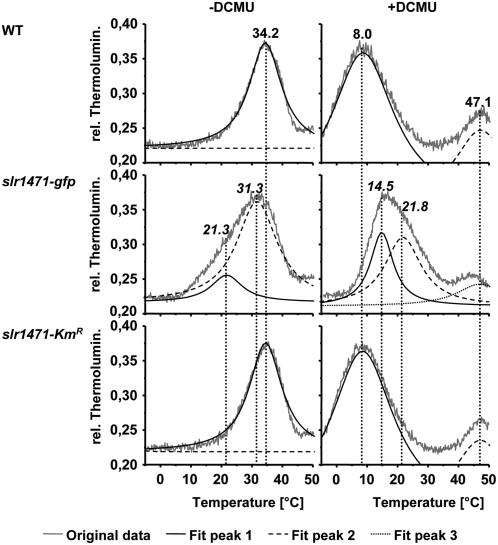
Figure 5.
QA and QB Redox Potentials Are Altered.
Thermoluminescence measurements were performed with wild-type, slr1471-gfp, and slr1471-KmR cells grown under 20 μmol·m−2·s−1 illumination in the absence (−) or presence (+) of 50 μM DCMU. Recorded thermoluminescence curves were mathematically fitted and deconvoluted into the components. Shown are the original data as well as the fitted curves for every peak of each strain. Temperatures for the highest emission of the fitted peaks are given for the B-bands (−DCMU), C-bands, and Q-bands (+DCMU).

