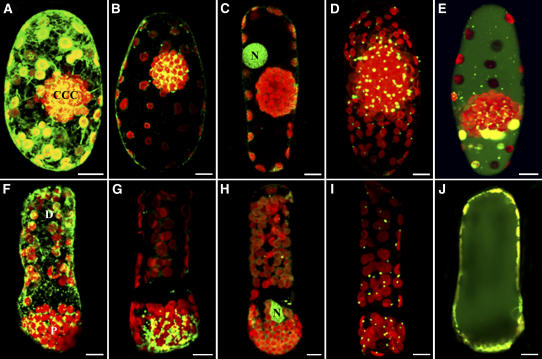
Figure 3.
Cell-Permeant Fluorescent Staining and Immunofluorescence Labeling Showing the Distribution of ER, Mitochondria, Nuclei, Peroxisomes, and Vacuoles in B. sinuspersici and S. aralocaspica Chlorenchyma Cells.
Representative results from three separate experiments are shown. Confocal microscopy of live and fixed Bienertia ([A] to [E]) and S. aralocaspica ([F] to [J]) chlorenchyma cells stained with various organelle-specific fluorescent dyes and antibodies demonstrate their spatial relationship with chloroplasts (red). Bars = 10 μm.
(A) and (F) Projections of chlorenchyma cells stained with DiOC6(3) showing reticular structures (green).
(B) and (G) Projections of rhodamine 123–stained chlorenchyma cells showing the concentration of mitochondria (yellow-green) in the CCC and proximal compartment.
(C) and (H) Single optical section (C) and projection of acridine orange–stained cells (H) showing the prominent position of nuclei (N; green) relative to the CCC and proximal compartment.
(D) and (I) Projections of fixed cells probed with catalase and Oregon green–conjugated secondary antibodies to visualize peroxisome (yellow-green) distribution.
(E) and (J) Single optical sections through the midplane of 5′(6)-carboxy-2′7′-dichlorofluorescein diacetate (carboxy-DCFDA)–stained cells showing the large vacuoles (green).

